


Back to top
Keep scrolling for a deep dive into the data

California is a big state with a large diversity in climate, geology and weather.
That means water use and supply are dependent on where you live, according to experts.
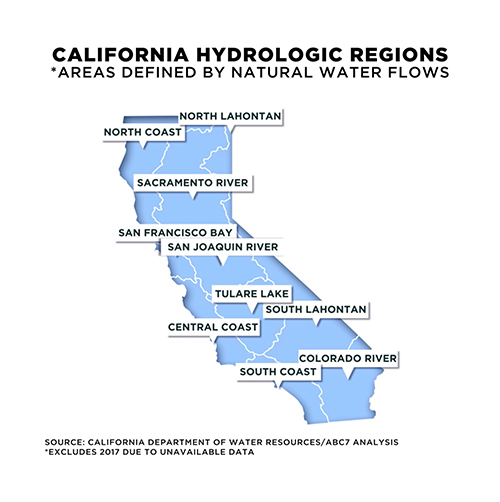
The state collects much of its water data by looking at these ten hydrologic regions, which are areas defined by natural water flows.
Where water comes from, as well as how it's used, can be drastically different region to region.
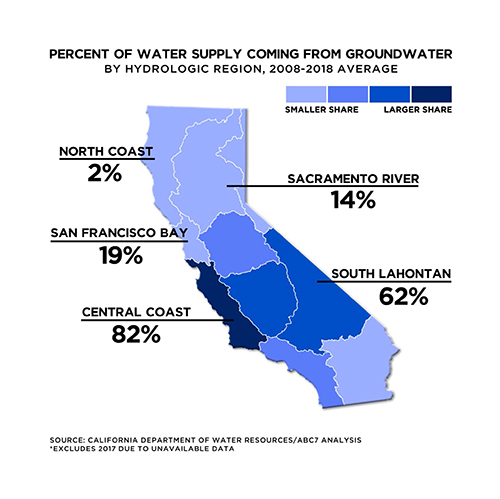
Take groundwater: Hydrologic regions in the northern part of the state have fewer supplies coming from groundwater. The San Francisco Bay region at an average of about 19%, the Sacramento River region averaging about 14% and the North Coast region at just 2% of total water supplies between 2008 and 2018.
Meanwhile, the South Lahontan region and the Central Coast region had 62% and 82% of its water supply coming from groundwater.
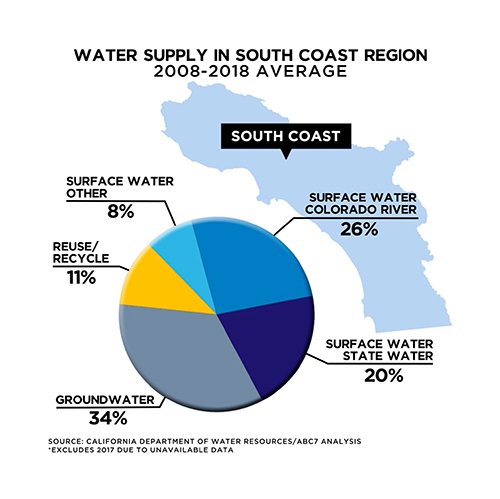
This is the South Coast region, which includes most of Ventura, Los Angeles, Orange and San Diego Counties along with parts of the Inland Empire.
On average, more than half of the South Coast water supply tends to come from surface water, like lakes, rivers and streams. Most of the surface water comes from the Colorado river or the State Water Project.
Ground water has, on average, made up about a third of the water supply.
Note: numbers on the chart do not add to 100% due to rounding.
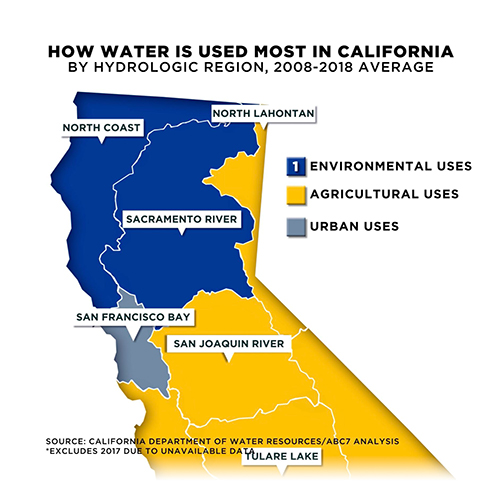
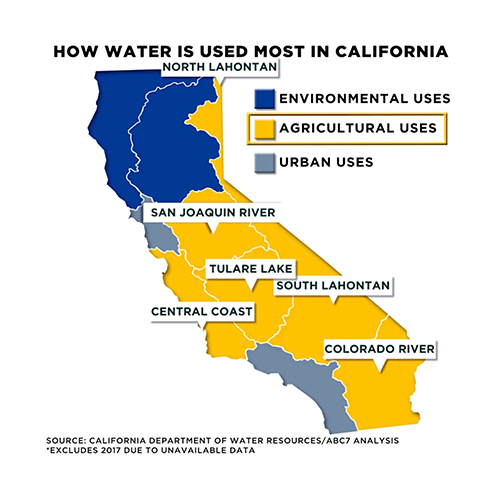
The way water is used in the state varies region-by-region as well.
In two of the most northern - and some of the least populated - regions of the state, environmental water holds the top spot, that's water dedicated to ensuring the health of ecosystems for fish and wildlife.
In most of the state - at least in terms of geographical area - water is used mostly for agriculture.
In fact, agricultural uses made up almost half of all water uses statewide on average between 2008 and 2018.
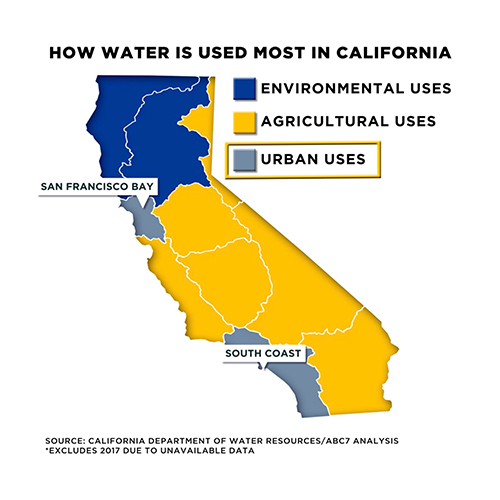
In the San Francisco Bay and the South Coast regions, where more than two-thirds of the state population lives, the water uses are mostly urban.
Urban uses include areas like large landscapes, parks, golf courses, factories, businesses and homes.
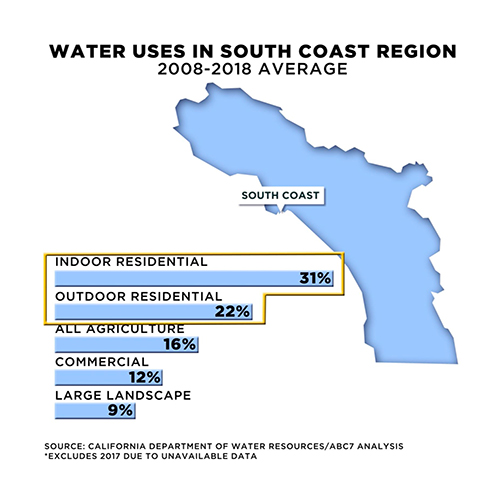
In the South Coast region, on average between 2008 and 2018, residential indoor and outdoor water made up the top two uses in the region - about 31% for indoor, and 22% for outdoor.
All agriculture made up 16% of water uses.
Then, commercial uses made up 12%, large landscapes like golf courses and parks made up about 9% of water uses.
Below is a Q&A with Jeanine Jones, the interstate resources manager at the California Department of Water Resources. To watch the whole video, simply press play. To skip to a specific question, explore the dropdown menu below.
Click on a box below to explore the resources